- ISIMS 2020 is Live on Twitter
2 group members, Elvin and Cameron, have presentations at the virtual ISIMS on twitter this year. Go check out what they’ve been working on!
https://twitter.com/CameronNaylor13/status/1289099758762512384?s=20
https://twitter.com/ISIMSSociety/status/1289089957475254272?s=20
https://twitter.com/CameronNaylor13/status/1289103887459205120?s=20
https://www.youtube.com/watch?v=JWrDpHiWMeY&feature=youtu.be
- Scriptorium Update: Ion Mobility Calculator
A brief, condensed tutorial of IMS calculations and simulation is provided in the following jupyter notebook. This example code is meant to serve as an introduction to the topic and provide tractable to enable correct reporting of ion mobility measurements.
Continued updates will pushed to the CRG github account including any changes to the ...
- IMS Spectral Simulator: Arduino Edition
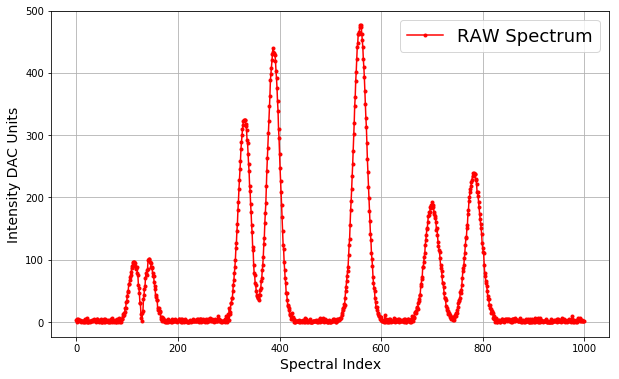
TL/DR — Code and wiring diagram to output a simulated spectrum WITH noise on a specified microcontroller output pin. Requires hardware interrupts which simulate a gating pulse.
When developing new approaches to signal processing or simply designing a new data acquisition system, having a reasonable reflection of the target signal is helpful during the ...
- Determining Proton Affinities using psi4
This is the 3rd post in a series outlining a workflow using freely available computational chemistry resources with python interfaces to evalute properties of gas-phase ions. A cursory search illustrates that there are a variety of computational packages with a direct python interface but interestingly, not all of these packages are current. PySCF appears to ...
- Geometry Optimization in Python
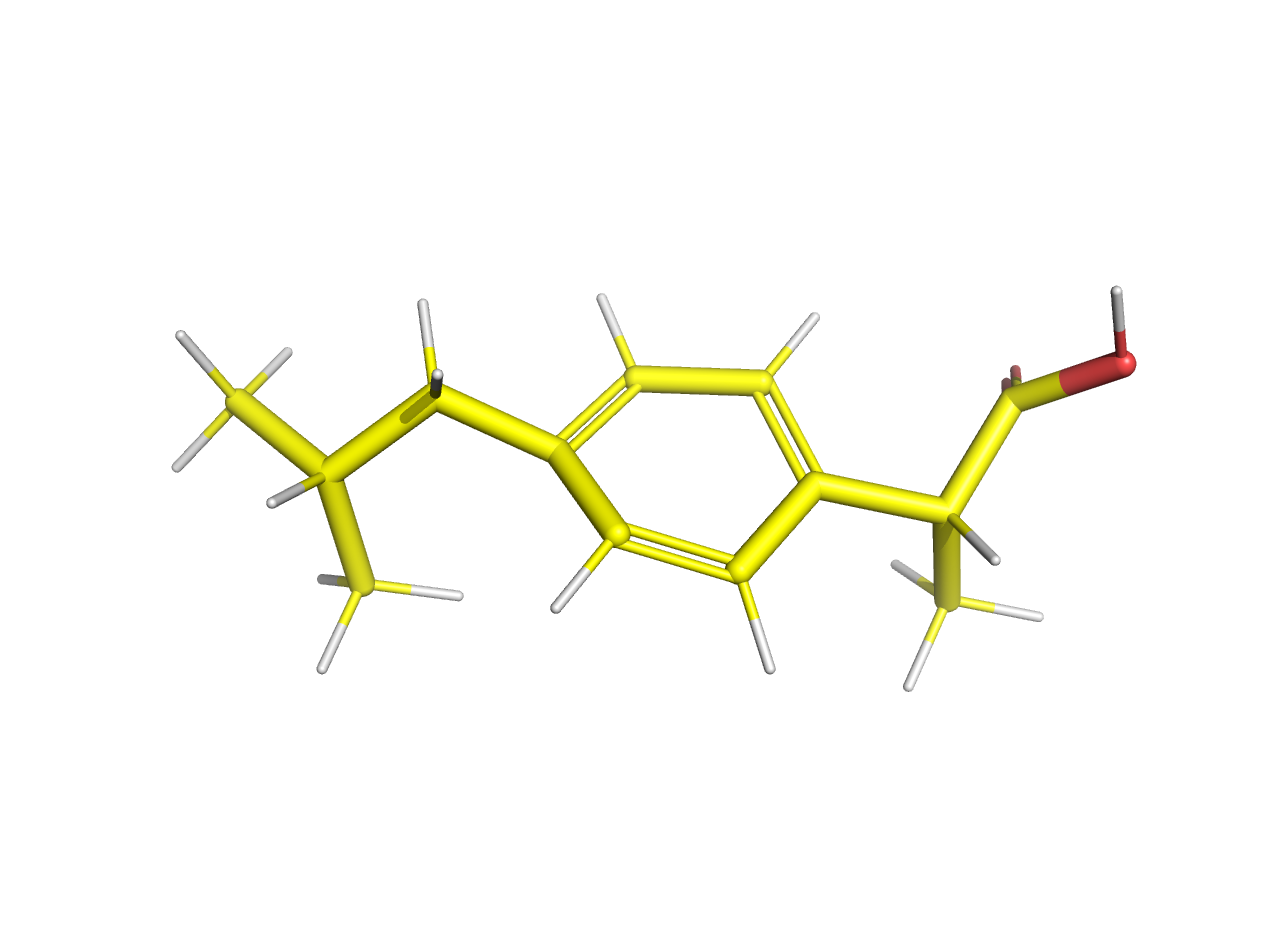
This is the second post in a series aiming at generating a range of candidate structures for evaluation in the context of molecular modeling in the field of ion mobility spectrometry. In a previous post, the use of rdkit to generate structures was introduced. However, closer inspection of the code highlights a few funciton calls ...
- Conformational Searching using Python
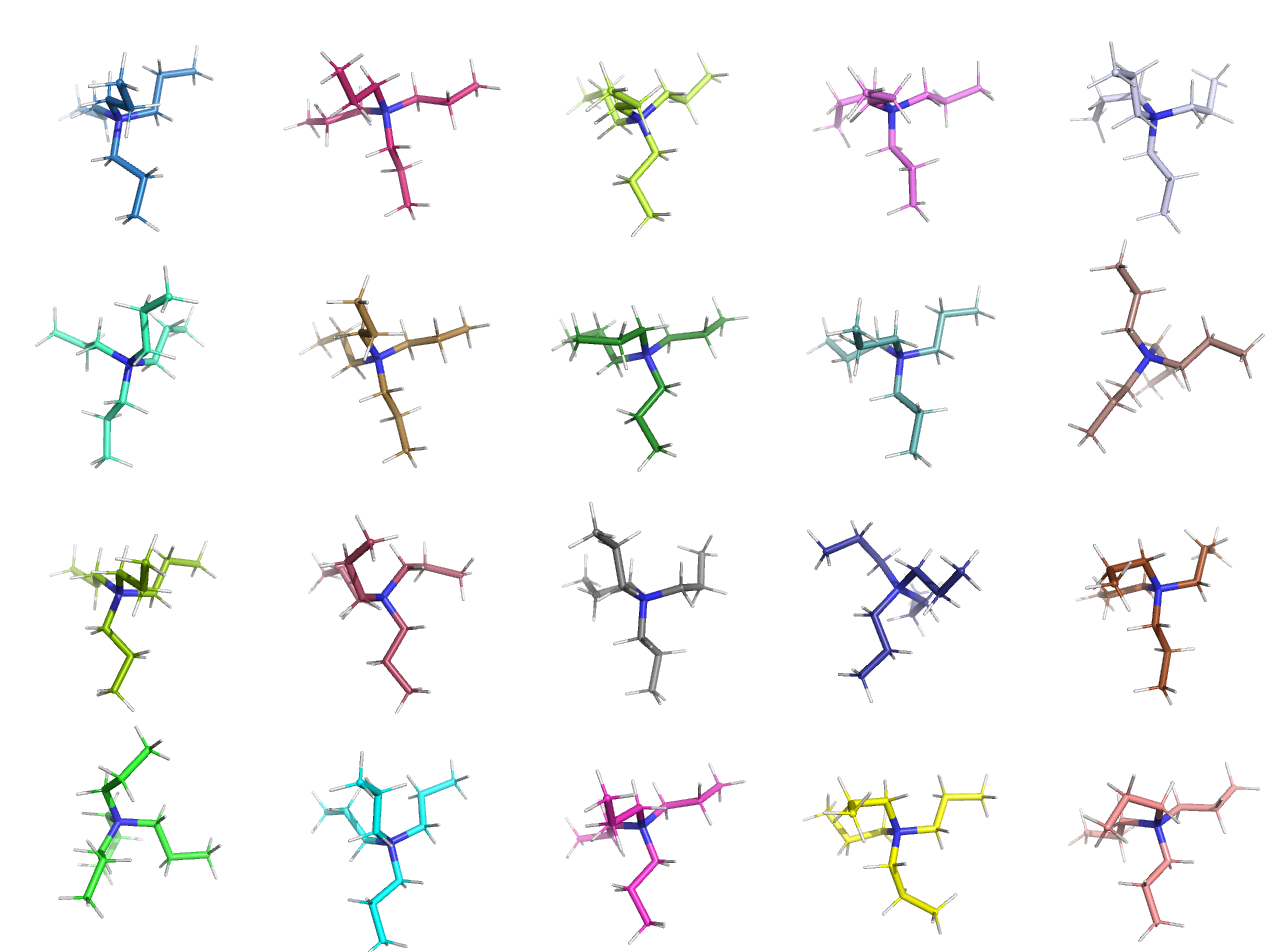
This is the first of a series examining the use of python to generate candidate structures of molecules. These conformations may serve a variety of functions, though our particular purpose is to identify candidates for additional optimization and ultimate use in ion mobility modeling experiments. After considering a range of tools (e.g. Avogadro or ChemDraw), ...
- Updated IMS Worksheet — 2018
For those that are interested, here is the spreadsheet used in the ASMS 2018 short course. Thank Dr. Bill Siems if you see him.
Ion Mobility Cal v3
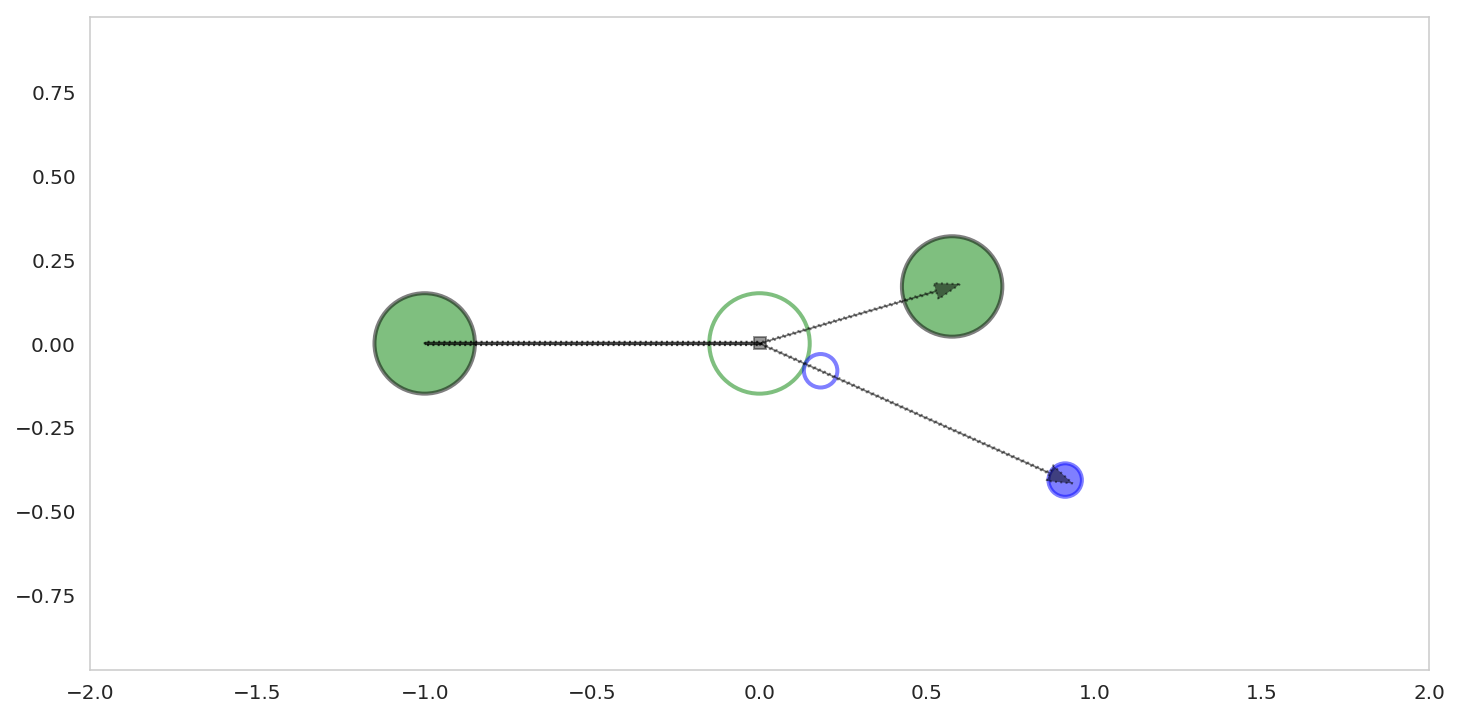
- Animation: Improving Rp by Increasing DT Cell Length
Austen has recently assembled an animation demonstrating the effect of increasing drift tube length on resolving power, calculated from peak width contributions from diffusion and gate pulse width. Click the image to view.
- IMS Short Course Worksheet
For those that are interested, here is the spreadsheet used in the ASMS 2018 short course. Thank Dr. Bill Siems if you see him.
Ion Mobility Cal v3
- Savitzky-Golay Smoothing GUI
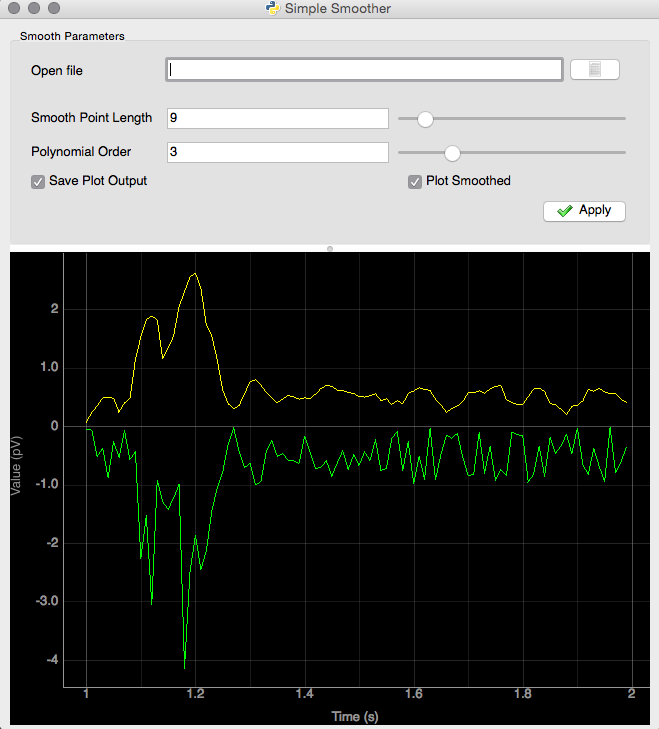
In an effort to create a set of simple tools that are useful for data processing and realtime analysis of data we’ve been exploring a range of tools. Granted there are a number of canned solutions in existence (e.g. National Instruments), however, to avoid the long-term challenges of compatibility we are looking for tools that ...
- Venn Diagram Widgets
Generally, it is recommended to avoid qualitative measures when quantitative solutions exist. However, if the genuine need arises here are a list of useful Venn diagram widgets that may be found online:
Quite Powerful: http://bioinformatics.psb.ugent.be/webtools/Venn/
Simple Solution: http://www.bioinformatics.lu/venn.php
Downloadable: http://pcarvalho.com/patternlab/vennDiagram.shtml
- Gantt Charts in Matplotlib

Love it or hate it, the lack of a tractable options to create Gantt charts warrants frustration at times. A recent post on Bitbucket provides a nice implementation using matplotlib and python as a platform. In order to expand the basic functionality a few modifications enable a set of features that highlight the relative contributions of ...
- XKCD-style Plots in Matplotlib
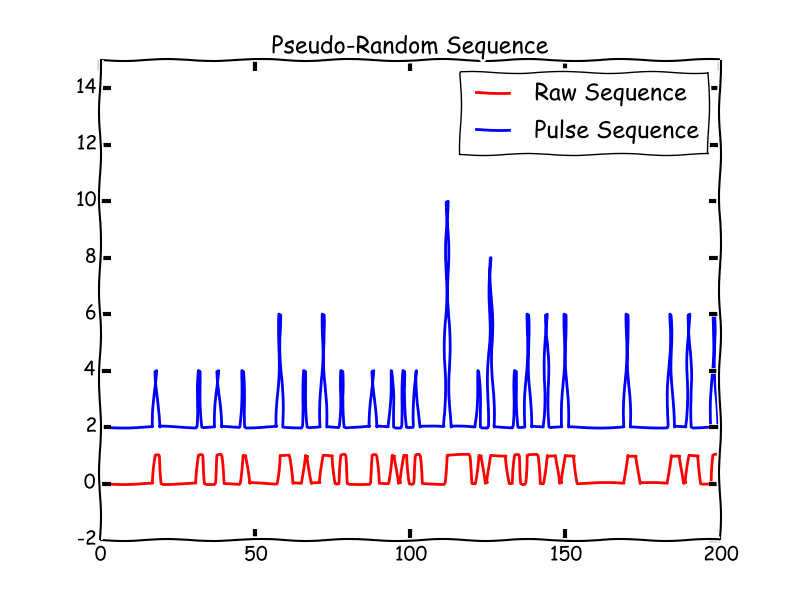
Now incorporated directly into the latest version of matplotlib (v1.3) here is a great alternative that brings some style to your plotting routines. I haven’t tried it out on plots with a huge number of points but I imagine it should work just fine. Below are some simple examples. Simple as matplotlib.pyplot.xkcd()…
Pseudo-Random Sequence with XKCD:
No ...
Comments are closed