
In an effort to create a set of simple tools that are useful for data processing and realtime analysis of data we’ve been exploring a range of tools. Granted there are a number of canned solutions in existence (e.g. National Instruments), however, to avoid the long-term challenges of compatibility we are looking for tools that can better serve our research goals. Two packages that we’ve began to lean more heavily upon include pyqtgraph and guidata. Both use PyQt4 and are compatible with Pyside for GUI rendering and construction. Matplotlib is quite mature but it has been our experience that pyqtgraph is quite a bit faster for plotting data in realtime.
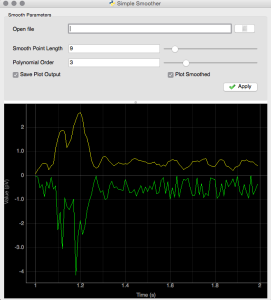
The code below integrates pyqtgraph directly into the guidata framework. This is not a huge stretch as the pyqtgraph widgets integrate directly with the QWidget class in PyQt4. For those looking for an example the following code illustrate very simply how to integrate one of these plots and update it using simulated data along with the ability to alter the smoothing parameters of the raw data on the fly. One might envision the use of this approach to capture data from a streaming device (more on that later). It should be noted that the file loading feature has been disabled but it would’t be a huge stretch to re-enable this functionality for single spectra.
# -*- coding: utf-8 -*-
# Adapted from guidata examples:
# Copyright © 2009-2010 CEA
# Pierre Raybaut
# Licensed under the terms of the CECILL License
# (see guidata/__init__.py for details)
# Adapted by Brian Clowers brian.clowers@wsu.edu

"""
DataSetEditGroupBox and DataSetShowGroupBox demo

These group box widgets are intended to be integrated in a GUI application
layout, showing read-only parameter sets or allowing to edit parameter values.
"""

SHOW = True # Show test in GUI-based test launcher

import tempfile, atexit, shutil, datetime, numpy as N

from guidata.qt.QtGui import QMainWindow, QSplitter
from guidata.qt.QtCore import SIGNAL, QTimer
from guidata.qt import QtCore

from guidata.dataset.datatypes import (DataSet, BeginGroup, EndGroup, BeginTabGroup, EndTabGroup)
from guidata.dataset.dataitems import (FloatItem, IntItem, BoolItem, ChoiceItem, MultipleChoiceItem, ImageChoiceItem, FilesOpenItem, StringItem, TextItem, ColorItem, FileSaveItem, FileOpenItem, DirectoryItem, FloatArrayItem, DateItem, DateTimeItem)
from guidata.dataset.qtwidgets import DataSetShowGroupBox, DataSetEditGroupBox
from guidata.configtools import get_icon
from guidata.qthelpers import create_action, add_actions, get_std_icon

# Local test import:
from guidata.tests.activable_dataset import ExampleDataSet

import sys, os
import pyqtgraph as PG

#-----------------------------------
def simpleSmooth(fileName, polyOrder, pointLength, plotSmoothed = False, saveSmoothed = True):
    if not os.path.isfile(fileName):
        return False
    rawArray = get_ascii_data(fileName)
    #savitzky_golay(data, kernel = 11, order = 4)
    smoothArray = savitzky_golay(rawArray, kernel = pointLength, order = polyOrder)
    if plotSmoothed:
        plot_smoothed(smoothArray, rawArray, True)

    if saveSmoothed:
        newFileName = fileName.split(".")[0]
        newFileName+="_smth.csv"

    N.savetxt(newFileName, smoothArray, delimiter = ',', fmt = '%.4f')

    return smoothArray

#-----------------------------------

def get_ascii_data(filename):
    data_spectrum=N.loadtxt(filename,delimiter = ',', skiprows=0)##remember to change this depending on file format
    return data_spectrum

#-----------------------------------
def savitzky_golay(data, kernel = 11, order = 4):
 """
 applies a Savitzky-Golay filter
 input parameters:
 - data => data as a 1D numpy array
 - kernel => a positive integer > 2*order giving the kernel size
 - order => order of the polynomal
 returns smoothed data as a numpy array

 invoke like:
 smoothed = savitzky_golay(<rough>, [kernel = value], [order = value]

 From scipy website
 """
 try:
 kernel = abs(int(kernel))
 order = abs(int(order))
 except ValueError, msg:
 raise ValueError("kernel and order have to be of type int (floats will be converted).")
 if kernel % 2 != 1 or kernel < 1:
 raise TypeError("kernel size must be a positive odd number, was: %d" % kernel)
 if kernel < order + 2:
 raise TypeError("kernel is to small for the polynomals\nshould be > order + 2")

 # a second order polynomal has 3 coefficients
 order_range = range(order+1)
 half_window = (kernel -1) // 2
 b = N.mat([[k**i for i in order_range] for k in range(-half_window, half_window+1)])
 # since we don't want the derivative, else choose [1] or [2], respectively
 m = N.linalg.pinv(b).A[0]
 window_size = len(m)
 half_window = (window_size-1) // 2

 # precompute the offset values for better performance
 offsets = range(-half_window, half_window+1)
 offset_data = zip(offsets, m)

 smooth_data = list()

 # temporary data, with padded zeros (since we want the same length after smoothing)
 #data = numpy.concatenate((numpy.zeros(half_window), data, numpy.zeros(half_window)))
 # temporary data, with padded first/last values (since we want the same length after smoothing)
 firstval=data[0]
 lastval=data[len(data)-1]
 data = N.concatenate((N.zeros(half_window)+firstval, data, N.zeros(half_window)+lastval))

 for i in range(half_window, len(data) - half_window):
 value = 0.0
 for offset, weight in offset_data:
 value += weight * data[i + offset]
 smooth_data.append(value)
 return N.array(smooth_data)

#-----------------------------------

def first_derivative(y_data):
 """\
 calculates the derivative
 """

 y = (y_data[1:]-y_data[:-1])

 dy = y/2#((x_data[1:]-x_data[:-1])/2)

 return dy

#-----------------------------------
class SmoothGUI(DataSet):
 """
 Simple Smoother
 A simple application for smoothing a 1D text file at this stage.
 Follows the KISS principle.
 """
 fname = FileOpenItem("Open file", ("txt", "csv"), "")

 kernel = FloatItem("Smooth Point Length", default=7, min=1, max=101, step=2, slider=True)
 order = IntItem("Polynomial Order", default=3, min=3, max=17, slider=True)
 saveBool = BoolItem("Save Plot Output", default = True)
 plotBool = BoolItem("Plot Smoothed", default = True).set_pos(col=1)
 #color = ColorItem("Color", default="red")

#-----------------------------------
class MainWindow(QMainWindow):
 def __init__(self):
 QMainWindow.__init__(self)
 self.setWindowIcon(get_icon('python.png'))
 self.setWindowTitle("Simple Smoother")

 # Instantiate dataset-related widgets:
 self.smoothGB = DataSetEditGroupBox("Smooth Parameters",
 SmoothGUI, comment='')

 self.connect(self.smoothGB, SIGNAL("apply_button_clicked()"),
 self.update_window)

 self.fileName = ''

 self.kernel = 15
 self.order = 3
 self.pw = PG.PlotWidget(name='Plot1')
 self.pw.showGrid(x=True, y = True)

 self.p1 = self.pw.plot()
 self.p1.setPen('g', alpha = 1.0)#Does alpha even do anything?
 self.p2 = self.pw.plot(pen = 'y')
 self.pw.setLabel('left', 'Value', units='V')
 self.pw.setLabel('bottom', 'Time', units='s')

 splitter = QSplitter(QtCore.Qt.Vertical, parent = self)

 splitter.addWidget(self.smoothGB)
 splitter.addWidget(self.pw)
 self.setCentralWidget(splitter)
 self.setContentsMargins(10, 5, 10, 5)

 # File menu
 file_menu = self.menuBar().addMenu("File")
 quit_action = create_action(self, "Quit",
 shortcut="Ctrl+Q",
 icon=get_std_icon("DialogCloseButton"),
 tip="Quit application",
 triggered=self.close)
 add_actions(file_menu, (quit_action, ))

 ## Start a timer to rapidly update the plot in pw
 self.t = QTimer()
 self.t.timeout.connect(self.updateData)
 self.t.start(1000)

 def rand(self,n):
 data = N.random.random(n)
 data[int(n*0.1):int(n*0.23)] += .5
 data[int(n*0.18):int(n*0.25)] += 1
 data[int(n*0.1):int(n*0.13)] *= 2.5
 data[int(n*0.18)] *= 2
 data *= 1e-12
 return data, N.arange(n, n+len(data)) / float(n)


 def updateData(self):
 yd, xd = self.rand(100)
 ydSmooth = savitzky_golay(yd, kernel = self.kernel, order = self.order)

 if self.smoothGB.dataset.plotBool:
 self.p2.setData(y=ydSmooth, x = xd, clear = True)
 self.p1.setData(y=yd*-1, x=xd, clear = True)
 else:
 self.p1.setData(y=yd, x=xd, clear = True)
 self.p2.setData(y=[yd[0]], x = [xd[0]], clear = True)

 if self.smoothGB.dataset.saveBool:
 if os.path.isfile(self.fileName):
 newFileName = self.fileName.split(".")[0]

 else:
 newFileName = "test"
 newFileName+="_smth.csv"

 N.savetxt(newFileName, ydSmooth, delimiter = ',')#, fmt = '%.4f')


 def update_window(self):
 dataset = self.smoothGB.dataset
 self.order = dataset.order
 self.kernel = dataset.kernel
 self.fileName = dataset.fname


if __name__ == '__main__':
 from guidata.qt.QtGui import QApplication
 app = QApplication(sys.argv)
 window = MainWindow()
 window.show()
 sys.exit(app.exec_())
Comments are closed